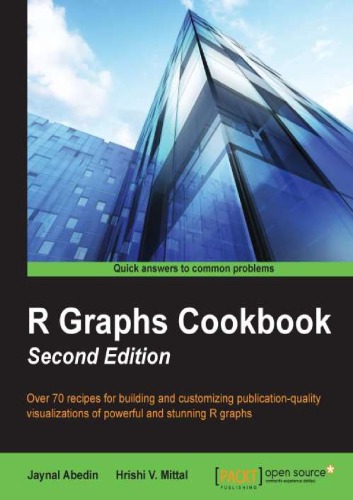
Description
About This Book
- Create a wide range of powerful R graphs
- Leverage lattice and ggplot2 to create high-quality graphs.
- Develop well-structured maps for efficient data visualization
Who This Book Is For
Targeted at those with an existing familiarity with R programming, this practical guide will appeal directly to programmers interested in learning effective data visualization techniques with R and a wide-range of its associated libraries.
What You Will Learn
-
- Create diverse types of bar charts using the default R functions
-
- Produce and customize density plots and histograms with lattice and ggplot2
-
- Visualize frequency tabulated data with interactive and beautiful graphs
-
- Inspect large datasets by simultaneously visualizing numeric and categorical variables in a single plot
-
- Construct multiple graph matrix layouts
-
- Annotate graphs using ggplot2
- Construct various types of three-dimensional plots using three-dimensional visualizations


Reviews
There are no reviews yet.