Description
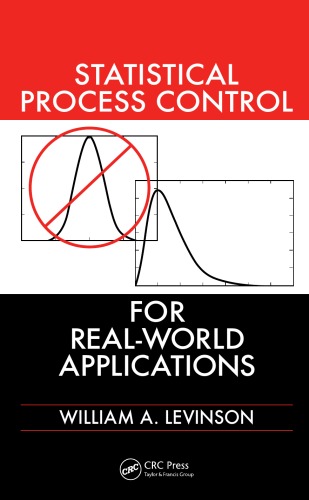
The book includes examples from Minitab®, StatGraphics® Centurion, and MathCAD and covers how to use spreadsheets to give workers a visual signal when an out of control condition is present. The included user disk provides Visual Basic for Applications functions to make tasks such as distribution fitting and tests for goodness of fit as routine as possible. The book shows you how to set up meaningful control charts and report process performance indices that actually reflect the process’ ability to deliver quality.The book exposes the pitfalls of assuming normality for all processes, describes how to test the normality assumption, and illustrates when non-normal distributions are likely to apply. It demonstrates how to handle uncooperative real-world processes that do not follow textbook assumptions. The text explains how to set realistic control limits and calculate meaningful process capability indices for non-normal applications. The book also addresses multivariate systems, nested variation sources, and process performance indices for non-normal distributions.


Reviews
There are no reviews yet.